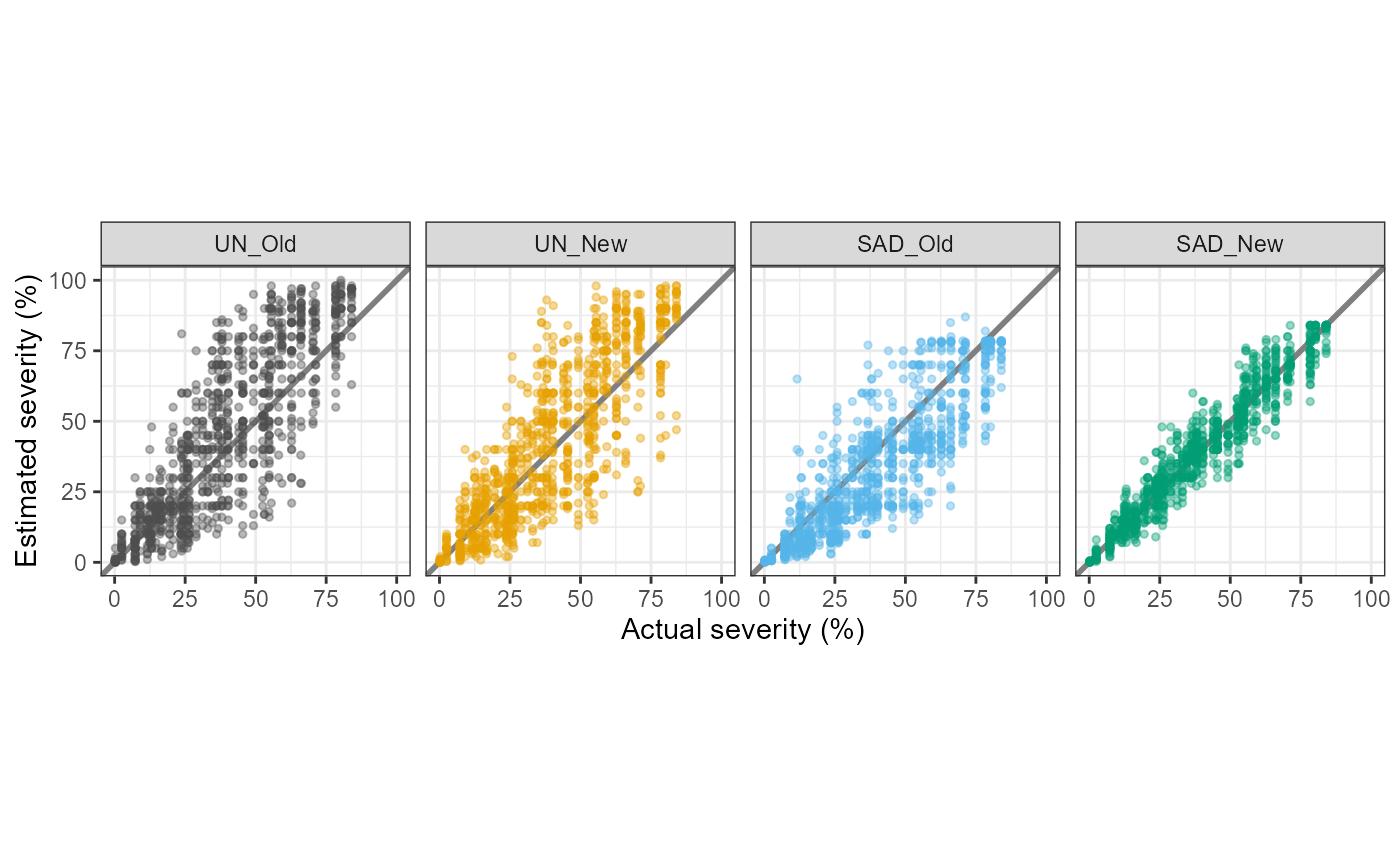
Produces the exploratory figures of a conventional SAD validation study: estimates against actual severity, Cb against r, boxplots of Lin's statistics, errors along the severity range, error densities, the standard deviation among raters along the severity range and the gain in accuracy relative to unaided estimates.
Usage
sad_plots(x, ccc = sad_ccc(x), baseline = NULL, palette = NULL)Arguments
- x
An object returned by
sad_data().- ccc
Statistics per rater, by default
sad_ccc(x).- baseline
Optional name of the method used as baseline (for example
"UN"); when given, the plot of gain in \(\rho_c\) against baseline accuracy is added.- palette
Optional named vector of colours, one per condition.