Combines fixed and random effects of a sad_fit() model into the bias of
each rater at the centring severity and the slope of the rater's estimates
on actual severity (1 = perfect calibration), per condition.
Arguments
- fit
An object returned by
sad_fit()withfamily = "gaussian".- x
An object returned by
sad_raters().- ...
Not used.
Value
sad_raters() returns a tibble with rater, condition,
method, bias_at_center (percentage points) and slope.
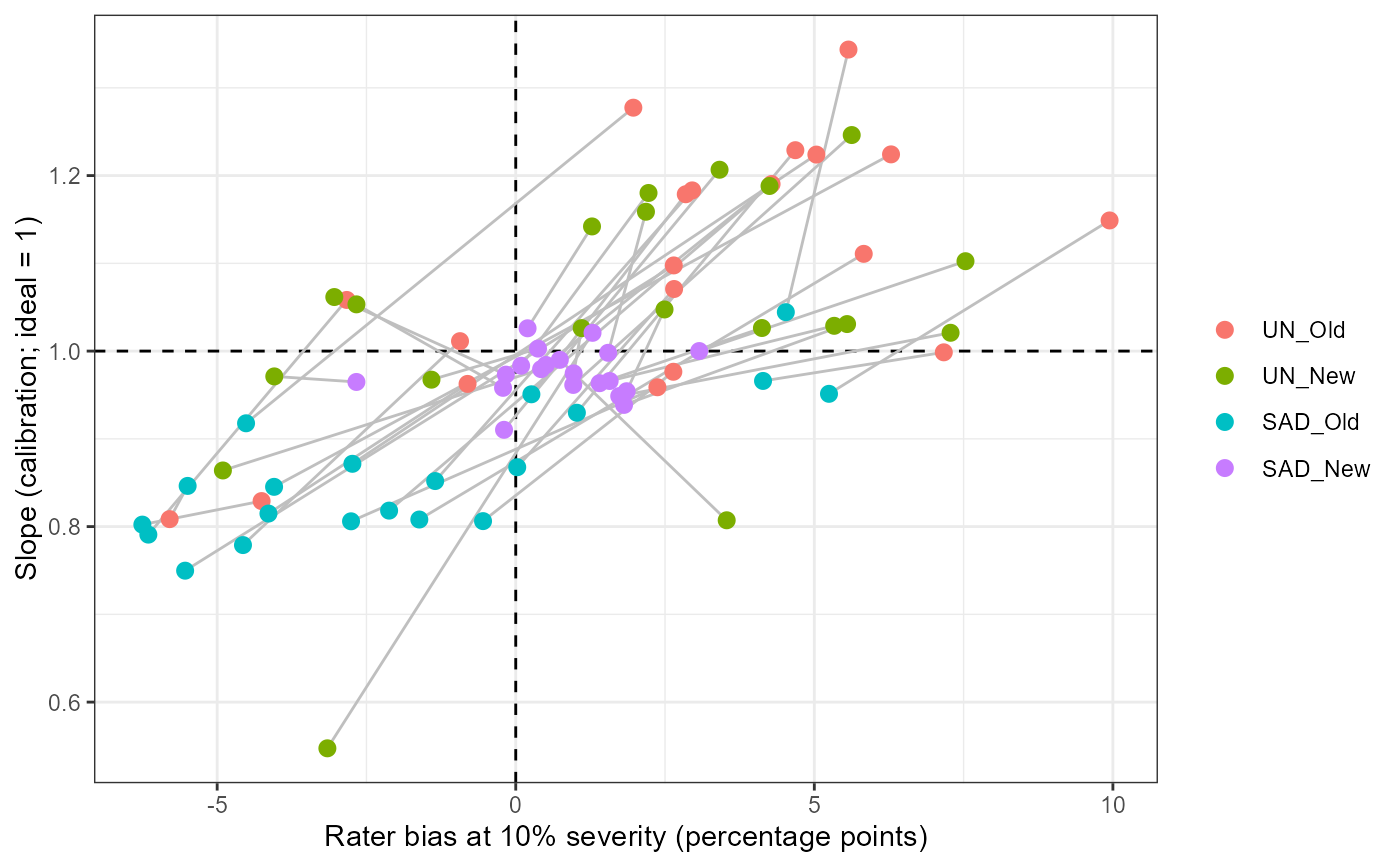
plot_sad_raters() returns a ggplot object, with lines linking the same
rater across conditions.
Examples
# \donttest{
if (requireNamespace("glmmTMB", quietly = TRUE)) {
x <- sad_data(SADRustSoybean, wide = c(UN = "unaided", SAD = "aided"), group = "sad")
rt <- sad_raters(sad_fit(x))
plot_sad_raters(rt)
}
#> Structure 'full' did not converge; trying the next one.
#> Structure 'noim' did not converge; trying the next one.
 # }