Code
Load packages
Customize ggplot themes
my_theme <- theme_bw() +
  theme(
    legend.position = "none",
    axis.line.x = element_line(color = "black", size = 0.5),
    axis.line.y = element_line(color = "white", size = 1),
    axis.text.y = element_blank(),
    axis.ticks = element_blank(),
    panel.border = element_blank(),
    panel.grid.major.x = element_blank(),
    panel.grid.minor.x = element_blank(),
    panel.grid.major.y = element_blank())

my_theme2 <- theme_bw() +
  theme(
    legend.position = "none",
    axis.line.x = element_line(color = "black", size = 0.5),
    axis.line.y = element_line(color = "white", size = 1),
    panel.border = element_blank(),
    panel.grid.major.y = element_blank(),
    panel.grid.minor.y = element_blank(),
  axis.text.y = element_text(face = "italic"))

my_theme3 <- theme_bw() +
  theme(
    legend.position = "none",
   axis.line.x = element_line(color = "black", size = 0.5),
    axis.line.y = element_line(color = "white", size = 1),
    panel.border = element_blank(),
    panel.grid.major.x = element_blank(),
    panel.grid.minor.y = element_blank(),
   legend.text = element_text(face = "italic"))
Read data from XLSX
Summary and visualization
All strains per year
Fig1A <- fus %>%
  tabyl(Host) %>%
    ggplot(aes(reorder(Host, n), n, label = n))+
     geom_col(fill = "#ffcc99", color = "black", size = 0.5)+
  theme(axis.text.x=element_text(face="italic"))+
      geom_text(position = position_dodge(width = 1),
            hjust = 0.5, vjust = -0.2) +
  labs(x = "", y = "Number of strains")+
  scale_y_continuous(expand = c(0, 0), limits = c(0, 600)) +
  my_theme
All strains per year
All strains per complexes
Fig1C <- fus %>%
  tabyl(Complexes) %>%
    ggplot(aes(reorder(Complexes, n),n, label = n))+
    geom_col(fill = "#ffcc99", color = "black", size = 0.5)+
   coord_flip()+
  theme(axis.text.x=element_text(face="italic"))+
      geom_text(position = position_dodge(width = 1),
            hjust = 0) +
  labs(x = "", y = "Number of strains")+
  scale_y_continuous( limits = c(0, 650)) +
  my_theme2
Figure 1
fig1 <- ((Fig1A / Fig1B) | Fig1C) + plot_annotation(tag_levels = 'A')
ggsave("figs/fig1.png", width =6, height =4)
fig1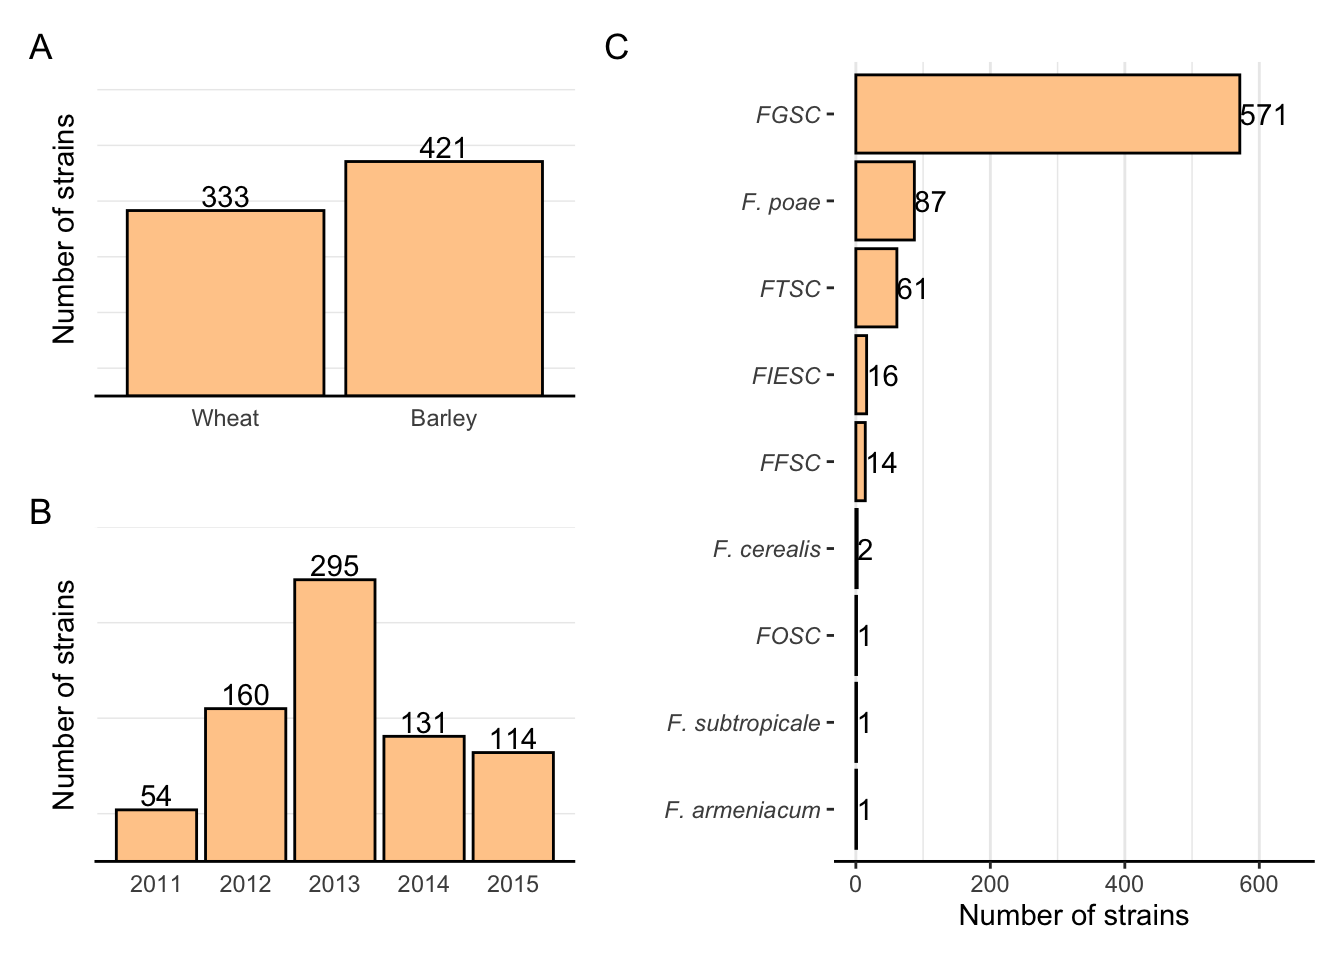
All species by host
Wheat
Fig2A <- fus %>%
  filter(Host == "Wheat") %>%
  tabyl(Complex2,  Year) %>%
  gather(year, n, 2:6) %>%
  ggplot(aes(year, n, fill = Complex2))+
    geom_col()+
scale_fill_brewer(palette = "Paired")+
 theme_light()+
  labs(x = "Year", y = "Number of strains", fill = "", title = "Wheat (n = 366)")+
   scale_y_continuous(expand = c(0, 0), limits = c(0, 180)) +
  my_theme3
Barley
Fig2B <- fus %>%
   filter(Host == "Barley") %>%
  tabyl(Complex2,  Year) %>%
  gather(year, n, 2:6) %>%
  ggplot(aes(year, n, fill = Complex2))+
    geom_col()+
  scale_fill_brewer(palette = "Paired")+
   theme_light()+
  labs(x = "Year", y = "Number of strains", fill = "", title = "Barley (n = 421)")+
       scale_y_continuous(expand = c(0, 0), limits = c(0, 180)) +
  my_theme3
Figure 2
patch <- Fig2A + Fig2B & theme(legend.position = "right")
p1 <- patch + plot_layout(guides = "collect")+ plot_annotation(tag_levels = 'A')
ggsave("figs/fig2.png", width =7, height =4)
p1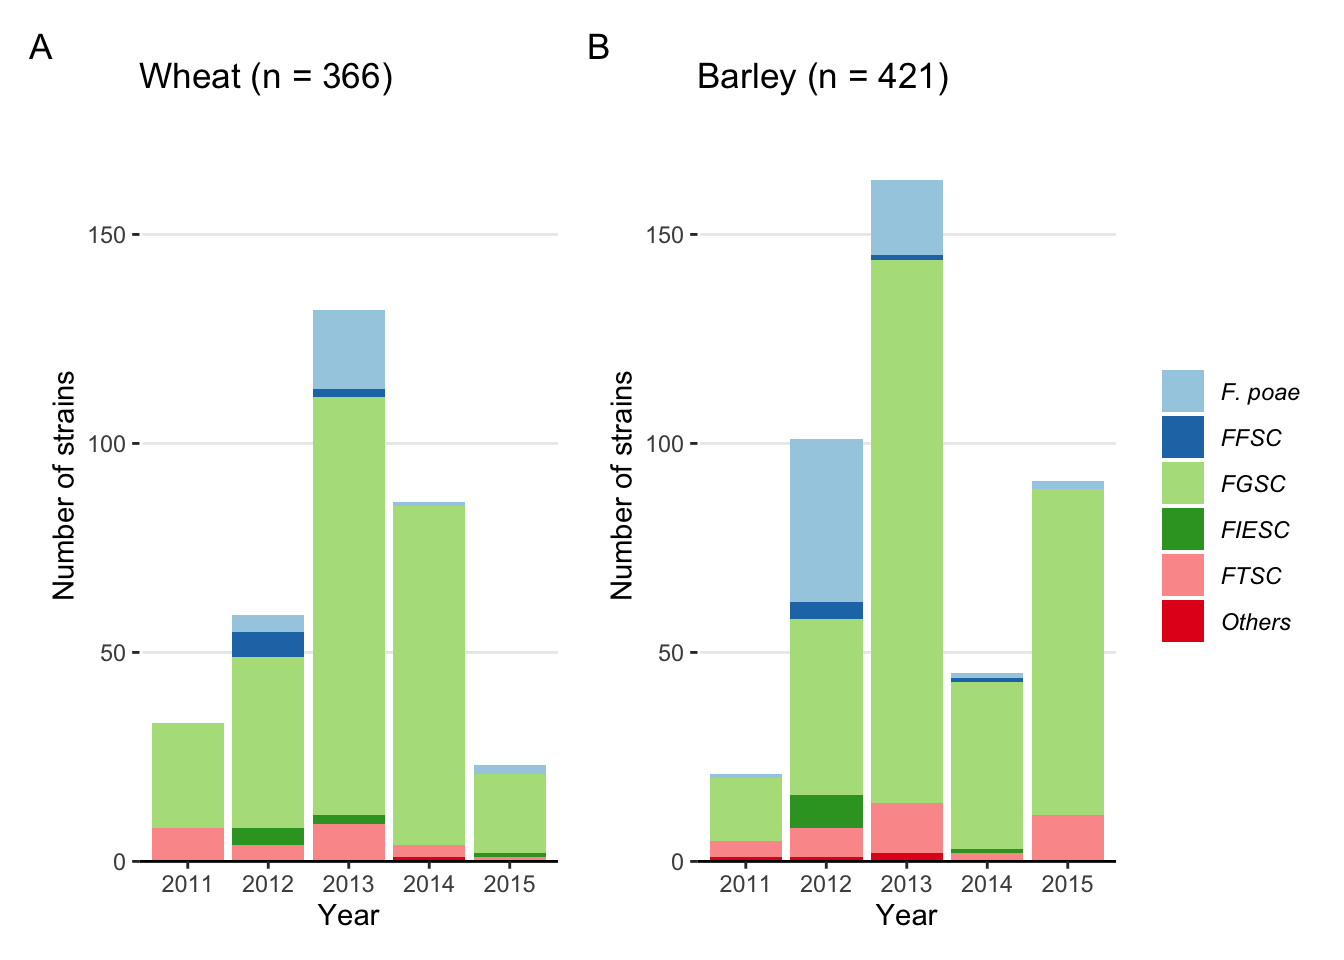
FGSC by host within year
Wheat
Fig3A <- fus %>%
  filter(Complex2 == "FGSC") %>%
  filter(Host == "Wheat") %>%
  tabyl(Species,  Year) %>%
  gather(year, n, 2:6) %>%
  ggplot(aes(year, n, fill = Species, label = n))+
    geom_col()+
  scale_fill_brewer(palette = "Dark2")+
 theme_light()+
  labs(x = "", y = "Number of strains", fill = "FGSC", title = "Wheat (n = 266)")+
         scale_y_continuous(expand = c(0, 0), limits = c(0,130)) +
  my_theme3
Barley
Fig3B <- fus %>%
    filter(Complex2 == "FGSC") %>%
   filter(Host == "Barley") %>%
  tabyl(Species,  Year) %>%
  gather(year, n, 2:6) %>%
  ggplot(aes(year, n, fill = Species))+
    geom_col()+
  scale_fill_brewer(palette = "Dark2")+
   theme_light()+
  labs(x = "", y = "Number of strains", fill = "FGSC", title = "Barley (n = 305)")+
       scale_y_continuous(expand = c(0, 0)) +
  my_theme3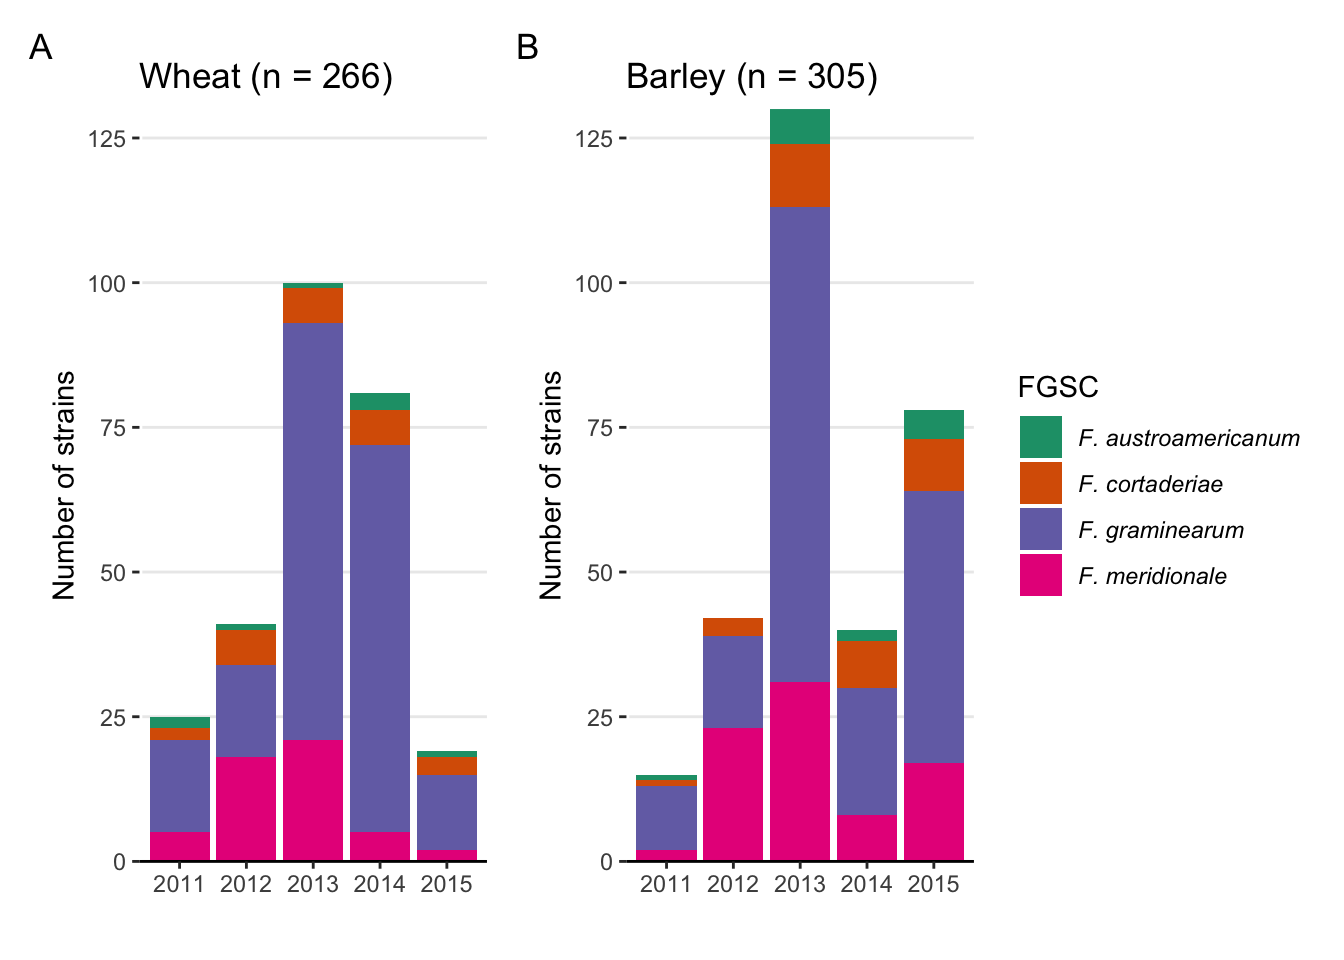
FTSC by host within year
Wheat
Fig3C <- fus %>%
    filter(Complex2 == "FTSC") %>%
   filter(Host == "Wheat") %>%
  filter(Species != "F. acuminatum") %>%
  tabyl(Species,  Year) %>%
  gather(year, n, 2:6) %>%
  ggplot(aes(year, n, fill = Species))+
    geom_col()+
    scale_fill_brewer(palette = "Set2")+
   theme_light()+

  labs(x = "Year", y = "Number of strains", fill = "FTSC", title = "Wheat (n = 25)")+
   scale_y_continuous(expand = c(0, 0), limits = c(0,12)) +
  my_theme3
Barley
Fig3D <- fus %>%
    filter(Complex2 == "FTSC") %>%
   filter(Host == "Barley") %>%
  tabyl(Species,  Year) %>%
  gather(year, n, 2:6) %>%
  ggplot(aes(year, n, fill = Species))+
    geom_col()+
  scale_fill_brewer(palette = "Set2")+
   theme_light()+
  labs(x = "Year", y = "Number of strains", fill = "FTSC", title = "Barley (n = 36)")+
     scale_y_continuous(expand = c(0, 0), limits = c(0,12)) +
  my_theme3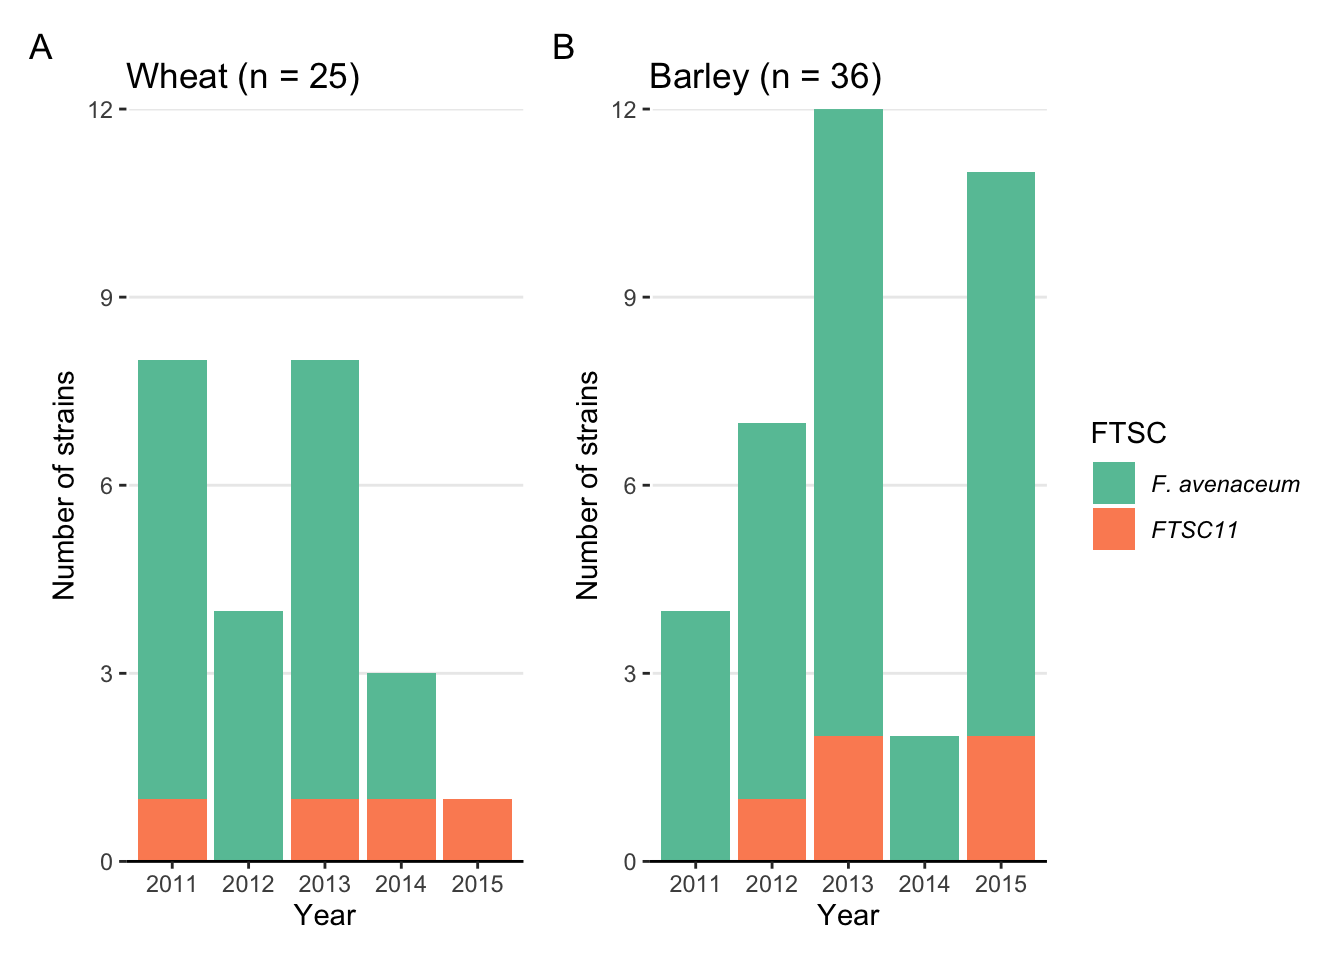
Independence tests
Host vs. complexes
## Warning in stats::chisq.test(., ...): Chi-squared approximation may be incorrect##
## Pearson's Chi-squared test
##
## data: host_complexes
## X-squared = 12.159, df = 8, p-value = 0.1443##
## Fisher's Exact Test for Count Data
##
## data: host_complexes
## p-value = 0.07159
## alternative hypothesis: two.sidedyear vs. complexes
##
##  Fisher's Exact Test for Count Data with simulated p-value (based on
##  2000 replicates)
##
## data:  year_complex2
## p-value = 0.0004998
## alternative hypothesis: two.sided
FGSC vs. host
##
##  Pearson's Chi-squared test
##
## data:  host_fgsc
## X-squared = 7.3975, df = 3, p-value = 0.06025
FGSC vs. year
year_fgsc <- fus %>%
  filter(Complex2 == "FGSC") %>%
  tabyl(Species, Year)
fisher.test(year_fgsc, simulate.p.value = T)
##
## Fisher's Exact Test for Count Data with simulated p-value (based on
## 2000 replicates)
##
## data: year_fgsc
## p-value = 0.0004998
## alternative hypothesis: two.sided