Plots
The plots below were presented in the article.
Boxplot FHB index
ggplot(fhb_sev, aes(AI_nspray2, sev))+
  geom_boxplot(size = 0.5, outlier.shape = NA)+
  geom_jitter(width=0.1, shape=1, size=2.5, color="gray50")+
  scale_x_discrete(labels=c("CHECK","CARB 2x", "PROP 2x" ,"TEBU 1x","TEBU 2x")) +
  theme_grey()+
  xlab("")+
  ylab("FHB index (%)")+
  scale_y_continuous(breaks=c(0, 10,  20,  30, 40, 50, 60, 70, 80, 90, 100), limits=c(0,100))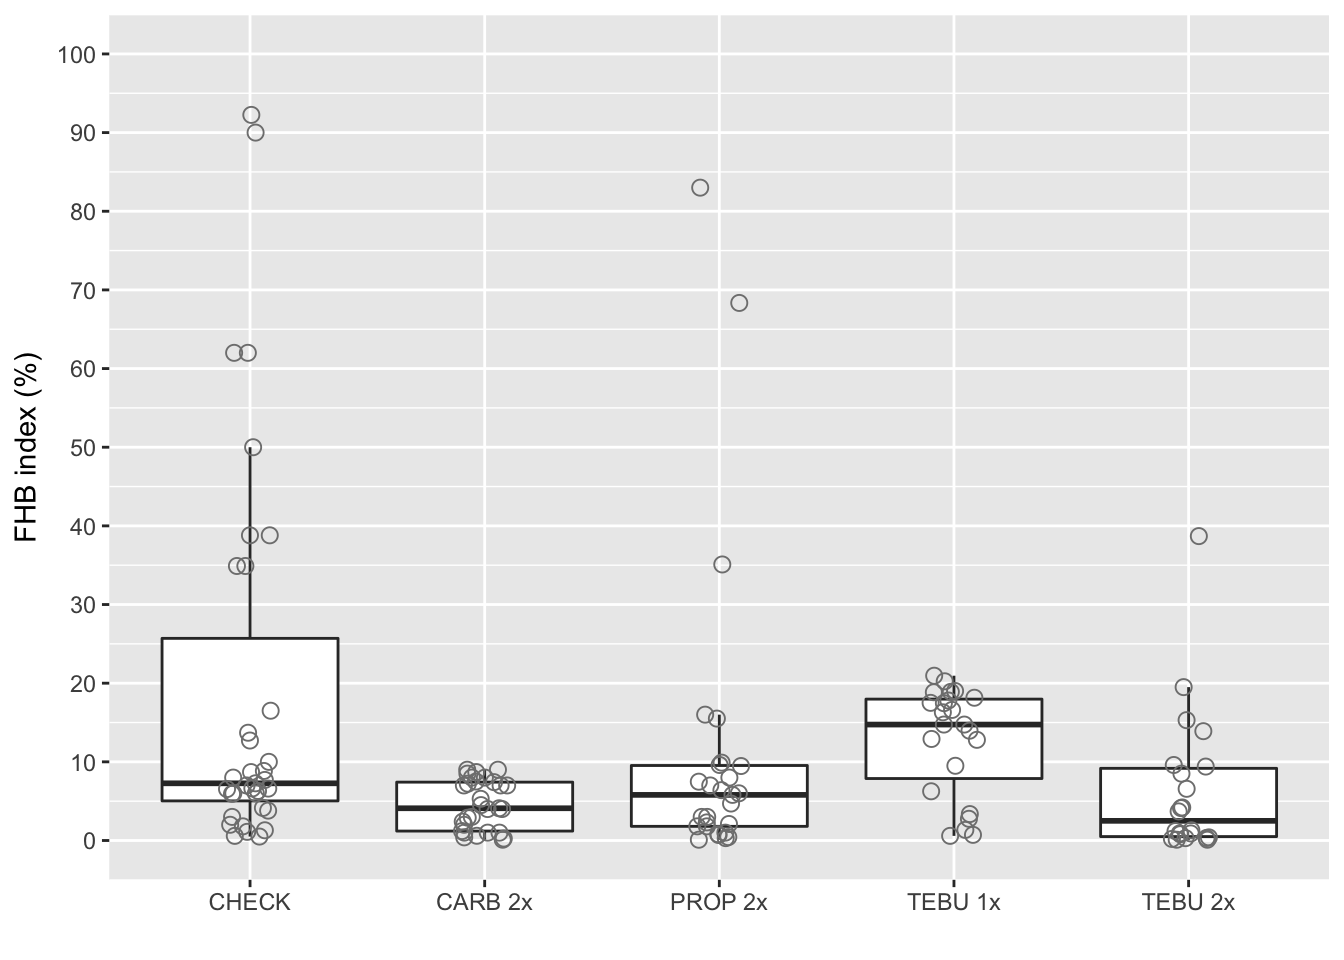
Boxplot yield
ggplot(fhb_yield, aes(AI_nspray2, yield))+
  geom_boxplot(size = 0.5, outlier.shape = NA)+ geom_jitter(width=0.1, shape=1, size=2.5, color="gray50")+
  scale_x_discrete(labels=c("CHECK","CARB 2x", "PROP 2x" ,"TEBU 1x","TEBU 2x")) +
  theme_grey()+
  xlab("")+
  ylab("Yield (kg/ha)")+
  scale_y_continuous(breaks=c(0, 1000,  2000, 3000, 4000, 5000, 6000))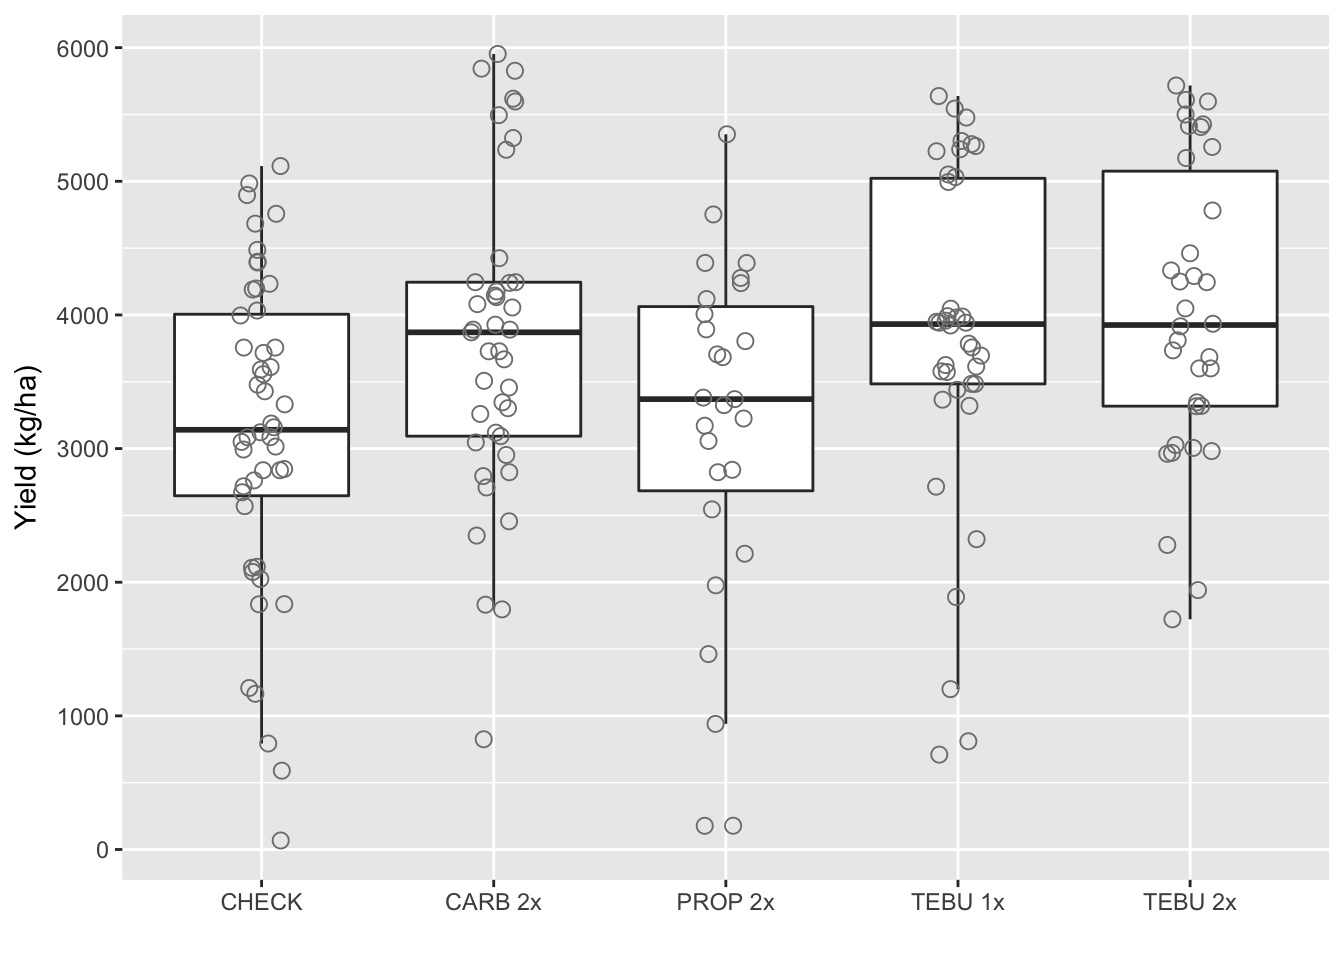
Plot yield diff
library(plyr)
fhb_yield$se <- sqrt(fhb_yield$vi2/sqrt(fhb_yield$n))

sum<-ddply(.data=fhb_yield,
               .(AI_nspray2),
               summarize,
               n=paste("n =", length(AI_nspray2)))
sum1<-sum %>% filter(AI_nspray2 != "AACHECK_0", AI_nspray2!="PROP_2",AI_nspray2 !="TEBU_1",AI_nspray2 !="TEBU_2")
Carbendazim 2x
##### CARB ########

fhb_yield %>%
  group_by(trial) %>%
  filter(AI_nspray2 != "AACHECK_0", AI_nspray2!="PROP_2",AI_nspray2 !="TEBU_1",AI_nspray2 !="TEBU_2") %>%   ggplot(., aes(reorder(treatment, D), D)) +
  geom_bar(stat="identity", fill = "steelblue")+
  geom_errorbar(width=0.5, size= 0.3, aes(ymax = D + se, ymin=D - se))+
  geom_text(data=sum1, aes(x=5, y=1200,label=n), inherit.aes=FALSE, parse=FALSE)+
  geom_text(aes(x=5, y=1400,label="CARB 2x"), inherit.aes=FALSE, parse=FALSE)+
  geom_hline(aes(yintercept=0), size = 0.1)+
  scale_y_continuous(breaks=c(-250,0, 250,  500, 750, 1000, 1250, 1500))+
  ylab("D (kg/ha)")+ xlab("Study treatments (sorted) ") +
    theme_grey()+
   theme(axis.text = element_text(size=11),
        axis.text.x=element_blank(),
        legend.position="none")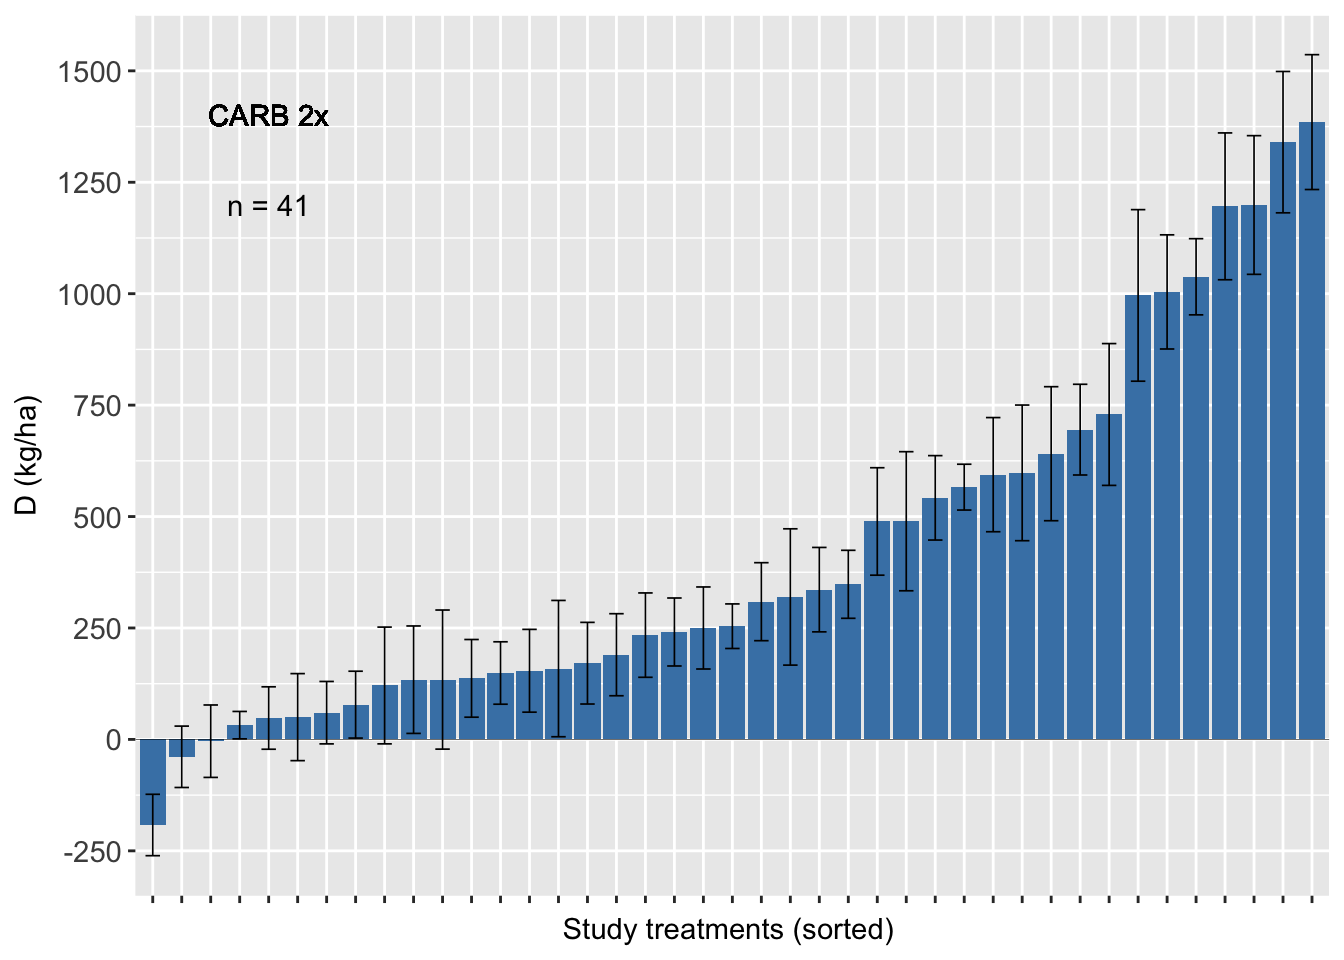
Propiconazole 2x
######PROP######

sum2<-sum %>% filter(AI_nspray2 != "AACHECK_0", AI_nspray2!="CARB_2",AI_nspray2 !="TEBU_1",AI_nspray2 !="TEBU_2")

fhb_yield %>% group_by(trial) %>% filter (AI_nspray2 != "AACHECK_0", AI_nspray2!="CARB_2",AI_nspray2 !="TEBU_1",AI_nspray2 !="TEBU_2") %>%
  ggplot(., aes(reorder(treatment, D), D)) +
  geom_bar(stat = "identity", fill = "steelblue")+
  geom_errorbar(width=0.5, size= 0.3, aes(ymax = D + se, ymin = D - se))+
  geom_text(data=sum2, aes(x=4, y=1200,label=n), inherit.aes=FALSE, parse=FALSE)+
  geom_text(aes(x=4, y=1400,label="PROP 2x"), inherit.aes=FALSE, parse=FALSE)+
  geom_hline(aes(yintercept=0), size = 0.1)+
  scale_y_continuous(breaks=c(-250,0, 250,  500, 750, 1000, 1250, 1500))+
  ylab(" ")+ xlab("Study treatments (sorted) ") +
   theme_grey()+
  theme(axis.text = element_text(size=11),
        axis.text.x=element_blank(),
        legend.position="none")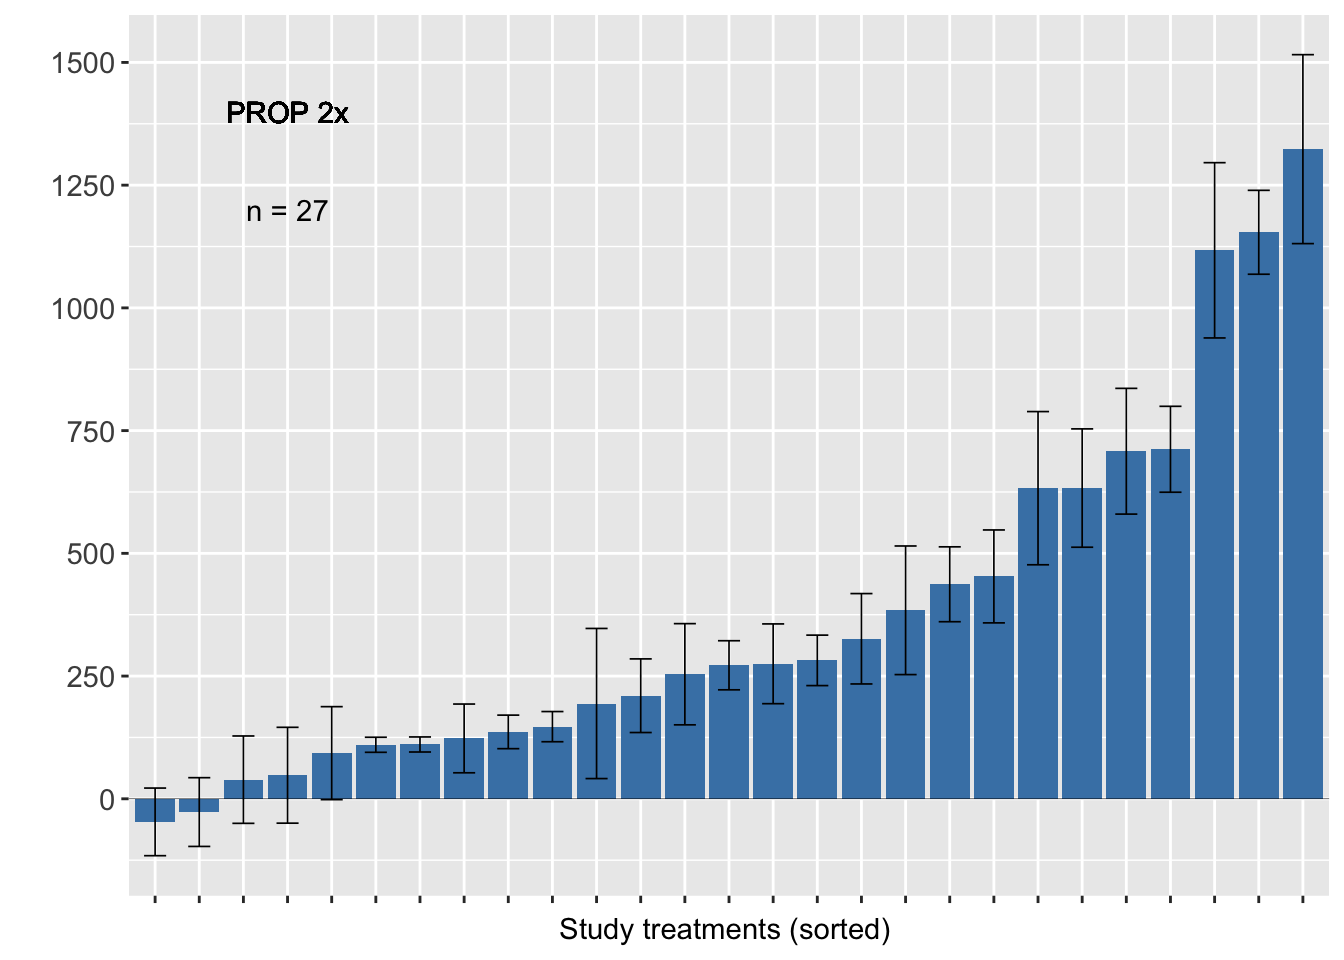
Tebuconazole 2x
sum3 <- sum %>% filter(AI_nspray2 != "AACHECK_0",
                       AI_nspray2!="CARB_2",
                       AI_nspray2 !="PROP_2",
                       AI_nspray2 !="TEBU_2")

fhb_yield %>%
  group_by(trial) %>%
  filter (AI_nspray2 != "AACHECK_0", AI_nspray2!="CARB_2",AI_nspray2 !="PROP_2",AI_nspray2 !="TEBU_2") %>%
  ggplot(., aes(reorder(treatment, D), D)) +
  geom_bar(stat="identity", fill = "steelblue")+
 geom_errorbar(width=0.5, size= 0.3, aes(ymax = D + se, ymin=D - se))+
  geom_text(data=sum3, aes(x=5, y=1300,label=n), inherit.aes=FALSE, parse=FALSE)+
  geom_text(aes(x=5, y=1500,label="TEBU 1x"), inherit.aes=FALSE, parse=FALSE)+
  geom_hline(aes(yintercept=0), size = 0.1)+
  scale_y_continuous(breaks=c(-250,0, 250,  500, 750, 1000, 1250, 1500))+
  ylab("D (kg/ha)")+ xlab("Study treatments (sorted) ") +
  labs(fill="Number of sprays" )+
   theme_grey()+
    theme(axis.text = element_text(size=11),
        axis.text.x=element_blank(),
legend.position="top") 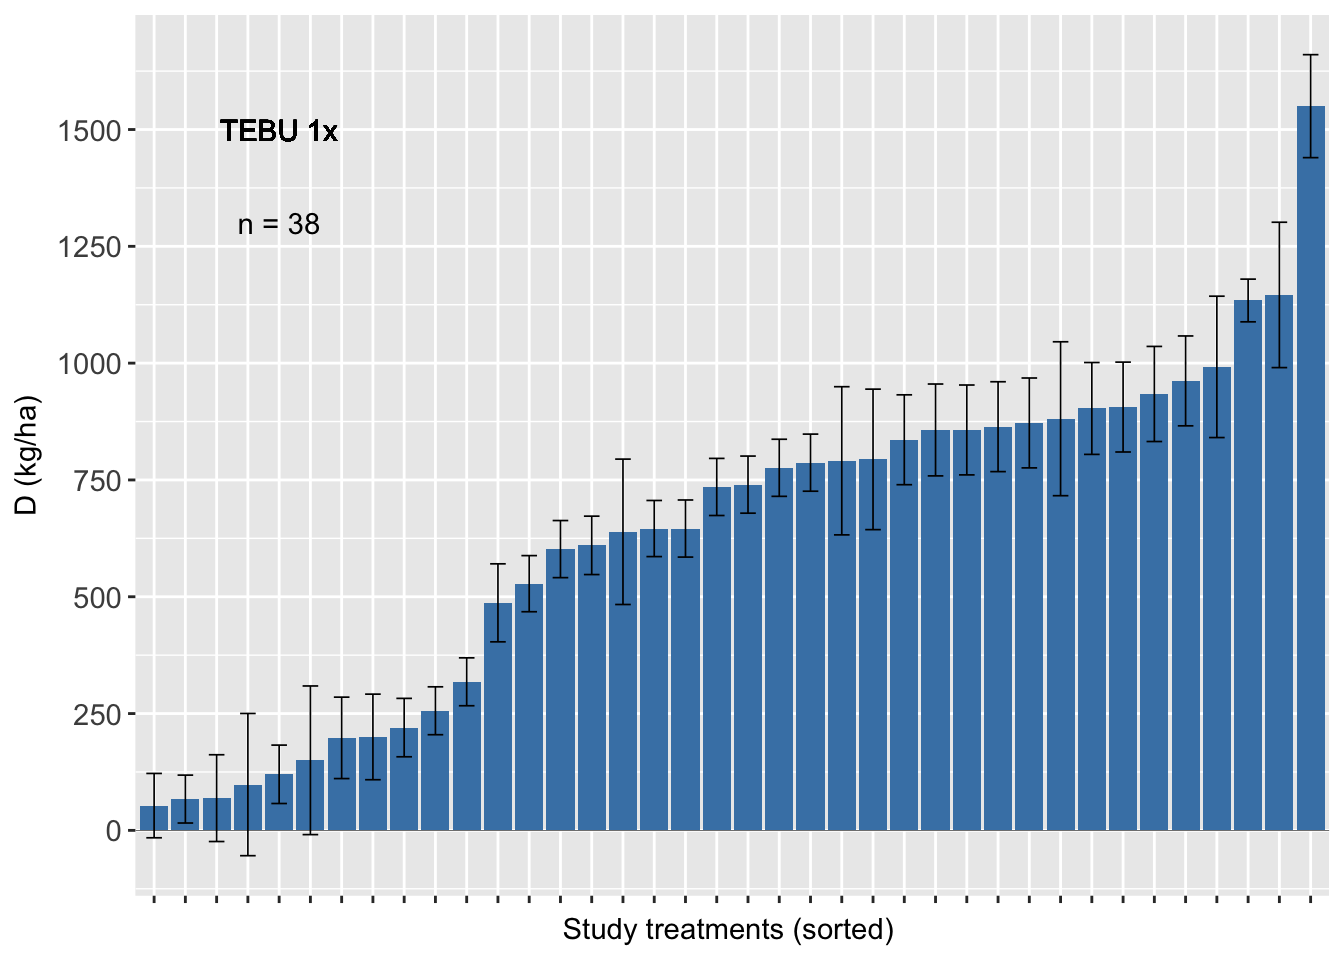
Tebuconazole 2x
sum4<-sum %>% filter(AI_nspray2 != "AACHECK_0", AI_nspray2!="CARB_2",AI_nspray2 !="PROP_2",AI_nspray2 !="TEBU_1")

fhb_yield %>% group_by(trial) %>% filter (AI_nspray2 != "AACHECK_0", AI_nspray2!="CARB_2",AI_nspray2 !="PROP_2",AI_nspray2 !="TEBU_1") %>%
  ggplot(., aes(reorder(treatment, D), D)) +
  geom_bar(stat="identity", fill = "steelblue")+
  geom_errorbar(width=0.5, size= 0.3, aes(ymax = D + se, ymin=D - se))+
  geom_text(data=sum4, aes(x=5, y=1200,label=n), inherit.aes=FALSE, parse=FALSE)+
  geom_text(aes(x=5, y=1400,label="TEBU 2x"), inherit.aes=FALSE, parse=FALSE)+
  geom_hline(aes(yintercept=0), size = 0.1)+
  scale_y_continuous(breaks=c(-250,0, 250,  500, 750, 1000, 1250, 1500))+
  ylab(" ")+ xlab("Study treatments (sorted) ") +
  labs(fill="Number of sprays" )+
   theme_grey()+
    theme(axis.text = element_text(size=11),
        axis.text.x=element_blank(),
legend.position="top") 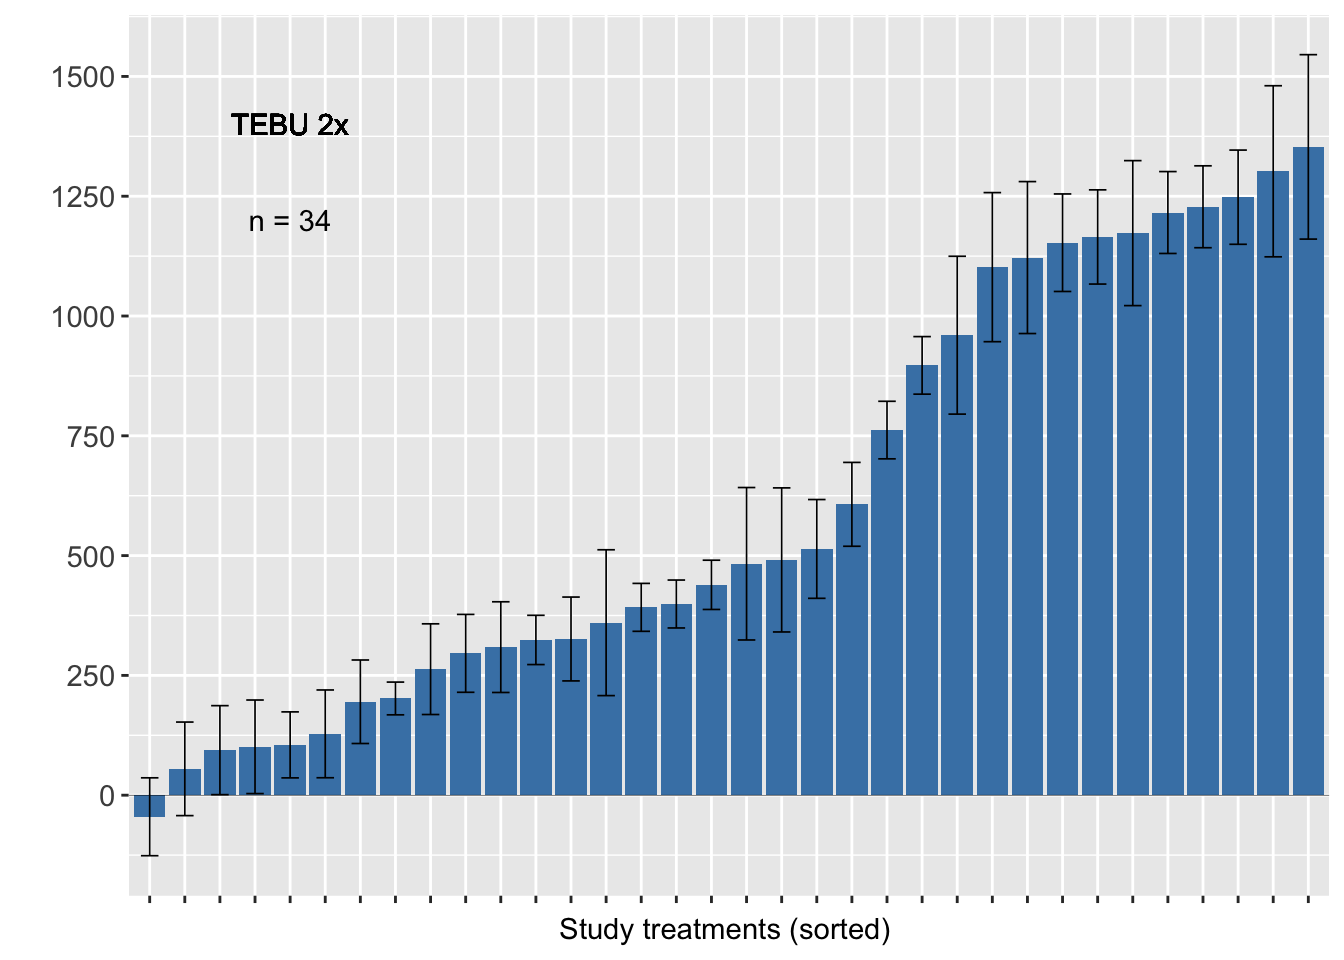
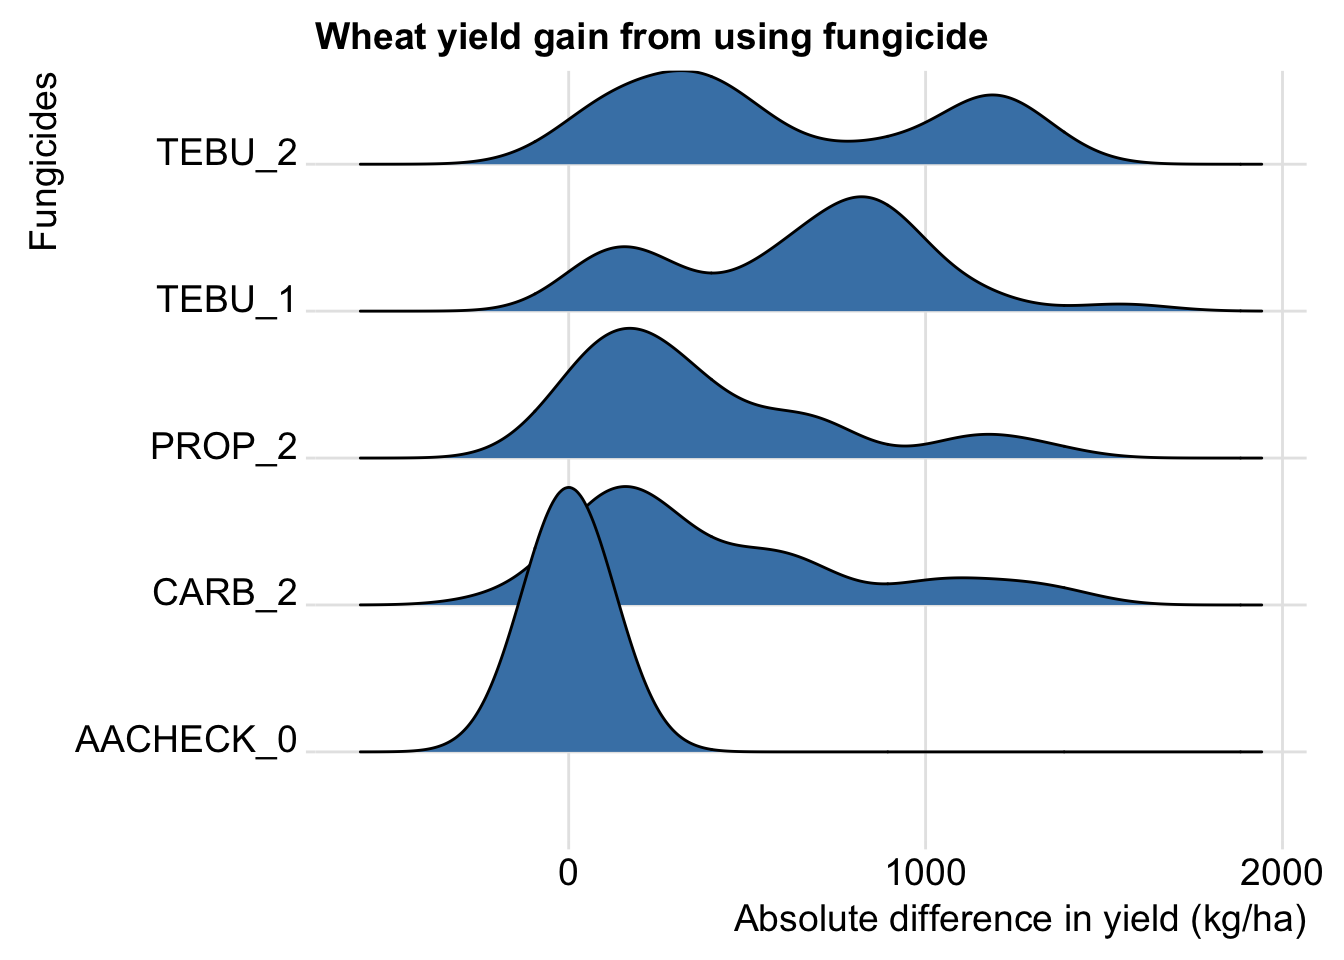
Density plots
Let’s look at the density of D for each fungicide in the same plot using the geom_joy function of the new `ggjoy’ package.
library(ggjoy)

fhb_yield %>%
  group_by(trial) %>%
  ggplot(aes(D, AI_nspray2, fill = AI_nspray2)) +
  geom_joy(fill = "steelblue")+
  theme_joy()+
  theme(legend.position = "none")+
  labs(y = "Fungicides", x = "Absolute difference in yield (kg/ha)",
       title = "Wheat yield gain from using fungicide ")