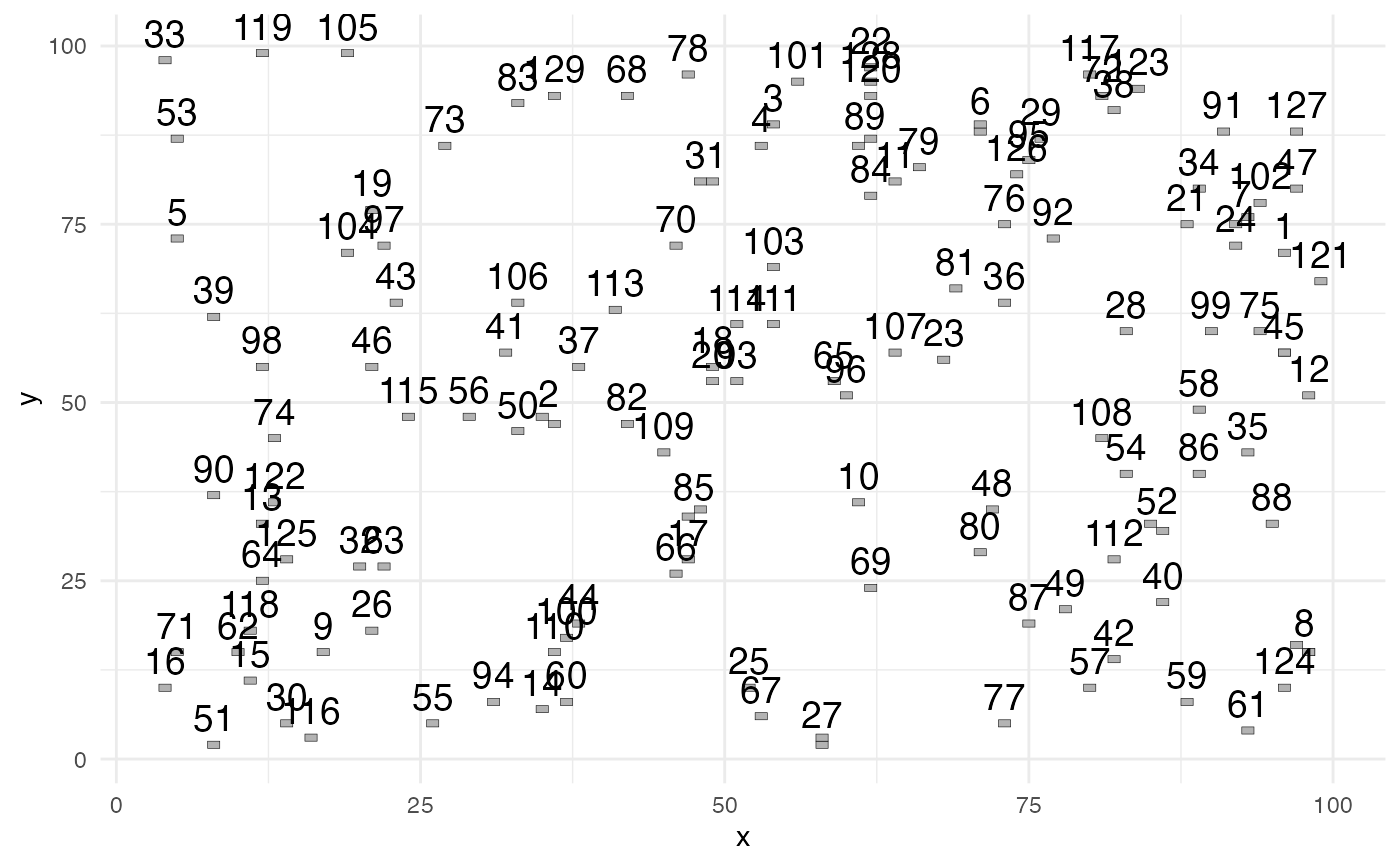
This function creates a tile plot of the foci (cluster) identified by the AFSD function. It colors each cell in a foci and labels the centroid of each cluster with the foci ID. The 'ggplot2' package is used for the plot, and will be automatically installed if not already present.
See also
Other Spatial analysis:
AFSD(),
BPL(),
count_subareas(),
count_subareas_random(),
fit_gradients(),
join_count(),
oruns_test(),
oruns_test_boustrophedon(),
oruns_test_byrowcol()

